

Introduction
Monitoring the wildlife in Africa’s nature reserves is crucial for tracking the animal population, their habitats, movement patterns and behaviors. This information is essential for many sanctuaries such as Kuzikus Nature Reserve in Namibia, who are with numerous applications, volunteer projects and various strategies, committed to preserving the wildlife and protecting the endangered species over an area of 100 square kilometers.
Current approach taken by Kuzikus to track the wildlife is by taking helicopter rides over the park and manually counting the animals, trees, and other important elements. This method, besides being expensive and time consuming, yields results which cannot be reproduced. The factors such as the animals being frightened by the helicopter noise or the measurements being dependent on human performance, which can be influenced in various ways, affects the reliability of the outcome.
Using high resolution images from unmanned aerial vehicles (UAVs) and the help of machine learning makes it more reliable and repeatable results can be obtained in a more efficient way. To achieve this, by developing a machine learning based detection model, two elements of the nature reserve, aardvarks and dead trees, are investigated. Identifying aardvark holes is essential for understanding the animals’ behaviors and their habitats by measuring distances between their burrows and exploring their possible tunnel systems. Furthermore, along being habitats to various insects, the dead trees are also used by the locals for carbon neutral power production or sold to create additional revenue.
For the dataset, the unprocessed images of the natural reserve, captured by the UAVs, are put together to create high-resolution, large photographic maps called orthomosaics. These orthomosaics are then sliced into more than 500 smaller images containing various animals, nests, trees, and bushes. Afterwards each aardvark hole and dead tree in these images are manually searched and labelled per Hand. Finally, these labelled images are used to train and test the detection model.

Method
For the development, the team was divided into two smaller parts. One team focused on deep learning tasks and the other team extracted the output of the first group and applied data science algorithms.
AI Team
The AI part consists of two main tasks:
- Finding the aardvark holes and dead trees in big, messy pictures (detection)
- Getting the exact shape of both to analyze (segmentation)
Luckily, the MASK R-CNN framework can do both! All you need is to get a good model for detecting and segmenting objects with the framework is a dataset, a good team and finally some patience to optimize the whole training process. First, we had to label over 500 images by hand to create the custom KUZIKUS dataset, and we can tell you, it was a tough job, because you might get lost in all those aardvark holes!
Having all these labeled images, we were finally able to create and train a model. We build our model using a pretrained resnet, where we modified the top layers to fit our application. To improve the training process, we tried out different sizes (resnet50, with 50 layers and resnet101, with 101 layers), which influenced the training process differently.
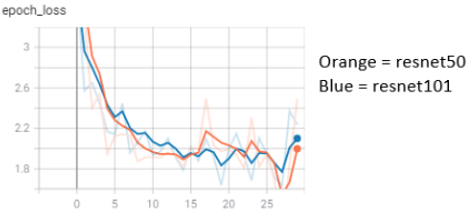
Additionally, we did some hyperparameter tuning. And the best tool we used was data augmentation to receive an even larger dataset. In case you don’t know what this is, and yes we also had to look it up, it’s just a simple procedure where images are mirrored, turned upside down or altered otherwise.

Now it was up to test the model and to evaluate using different methods. Therefore, we created a notebook that was able to generate a confusion matrix, where you can display the accuracy of detections and consequently discover possible weaknesses.
Data Science Team
In the data science part, we used the outputs resulted from the Mask RCNN architecture which consists of Image Recognition, Semantic Segmentation, Object Detection and Instance Segmentation. For each detected object, Mask RCNN gives us a bounding box around the object ([x-Axis, y-Axis, width, height]) and a binary array for the mask, where True values represent the pixels which belongs to the mask.
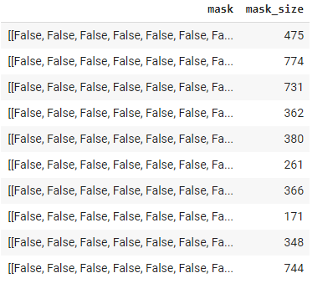
Seeing the information presented by Mask RCNN, our next step was to appropriately store the data. We did that by constructing one DataFrame for aardvark holes and another for dead trees, where we gave each detected object its own row. We started with the following columns, which represent all the information we have from Mask RCNN output: ID (a unique identifier we gave using a hash function), label (dead tree or aardvark hole), origin (original directory), pic positions for x and y coordinates (giving us the position of the slice in the original big picture), bounding box coordinates and the mask array. By summing the True values in the mask array, we got the mask size (sum of pixels filled by the mask) and keeping the information in mind that one pixel corresponds approximately to 4 cm², we could calculate the real size.

Our next step was to compute the centroid of each bounding box in order to reduce the information and working only with ‘points’ instead of ‘areas’ made our analysis easier and enables us to see the locations of the aardvark holes nicely in a scatter plot.
Aardvarks are known for their holes, but also for their underground tunnel systems. Research provided by the Kuzikus wildlife reserve shows, that tunnels between two holes can be up to 10 meters long. With this distance in mind, we sat our next goal to find the holes that could possibly be connected, forming a bigger tunnel system. With the help of the distance matrix, we could extract the ‘neighbours’ for each hole and we created the clusters in a way that would include all the possible connected holes. If the 36. and 39. holes are both connected to hole 38, the cluster list included all 3 holes in one group. Finally, giving same group number to the ones located in the same cluster, we added a ‘group’ column and hereby our data frame took its final form.

Furthermore, plotting all the holes according to their sizes further enabled us to see the range and distribution of all the holes. Our results show that the mean of hole sizes is approximately 0.13 sqm, while the median is around 0.11 sqm. We can see a bell curve which is what we expect for a natural phenomenon.

Although our model gave us very good results while estimating the real sizes of the aardvark holes, it wasn’t as successful dealing with the dead tree, considering their complex shapes. We can see on the image below that our mask is not precise enough, therefore we shifted our attention to apply image segmentation and worked further with K-Means Clustering and Self-Organizing Maps.

Results
The final results of our Mask R-CNN model were showing us that the aardvark holes were better predicted than the dead trees. And to our surprise sometimes the model even showed us aardvark holes where none were labelled. As you can see, not even a very messy terrain was a problem!

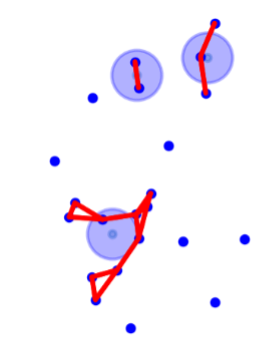
With plotting centroid of each hole and adding connecting lines between the holes which belong to the same cluster, we achieved a good visualisation of all holes and clusters.

A further idea would be calculating the center of the clusters and drawing a circle. Although we only tried this with a fixed idea, this can be modified according to the size of the cluster and can be further used to improve the AI part, considering the possibility of the existing holes would be higher in the given circles.
With K-Means Clustering we attained the segmented image, its colors and absolute values of each color which can be seen in the image, followed by our results from the Self-Organizing Maps.

We already can see the main problem here: the colors are just too similar. Although it seems to taking just the shadow on the K-Means Clustering can be useful, this is not an universal solution.
Conclusion and Outlook
After training and testing, our model was still not as sufficient as we expected. Of course, we were already happy that our model worked but as an ambitious team we wanted to get more. So, what was left to do?
We had a look at the dataset. Considering that many different people are labelling (who are not all experts on the Kuzikus wildlife), the dataset was not labelled uniformly. Additionally, we improved the precision of the masks to get even sharper and clearer results. As you see, using state of the art techniques doesn’t always bring the best solution and sometimes one should go back to beginning: a good dataset is an essential point that you don’t want to miss and adding some more pictures and being more careful with the labelling process bring way more than one would expect!
Since there are many elements in the Kuzikus terrain itself, for future work, it is also worth including more elements into the investigation, i.e.: springhare holes, trees and bushes to understand more comprehensively the relation between animals and its vegetations.
Lastly, this method of combining UAV-based image sampling, machine learning and data science has provided a reliable way for the development of data-driven wildlife surveys in conservation areas, which also can be embedded in other habitats and ecosystems.